
|
|

|
||
 Geomorphic Assessment of Channel Systems
G
S
M
(
T
IL
H
E
)
A
YEAR
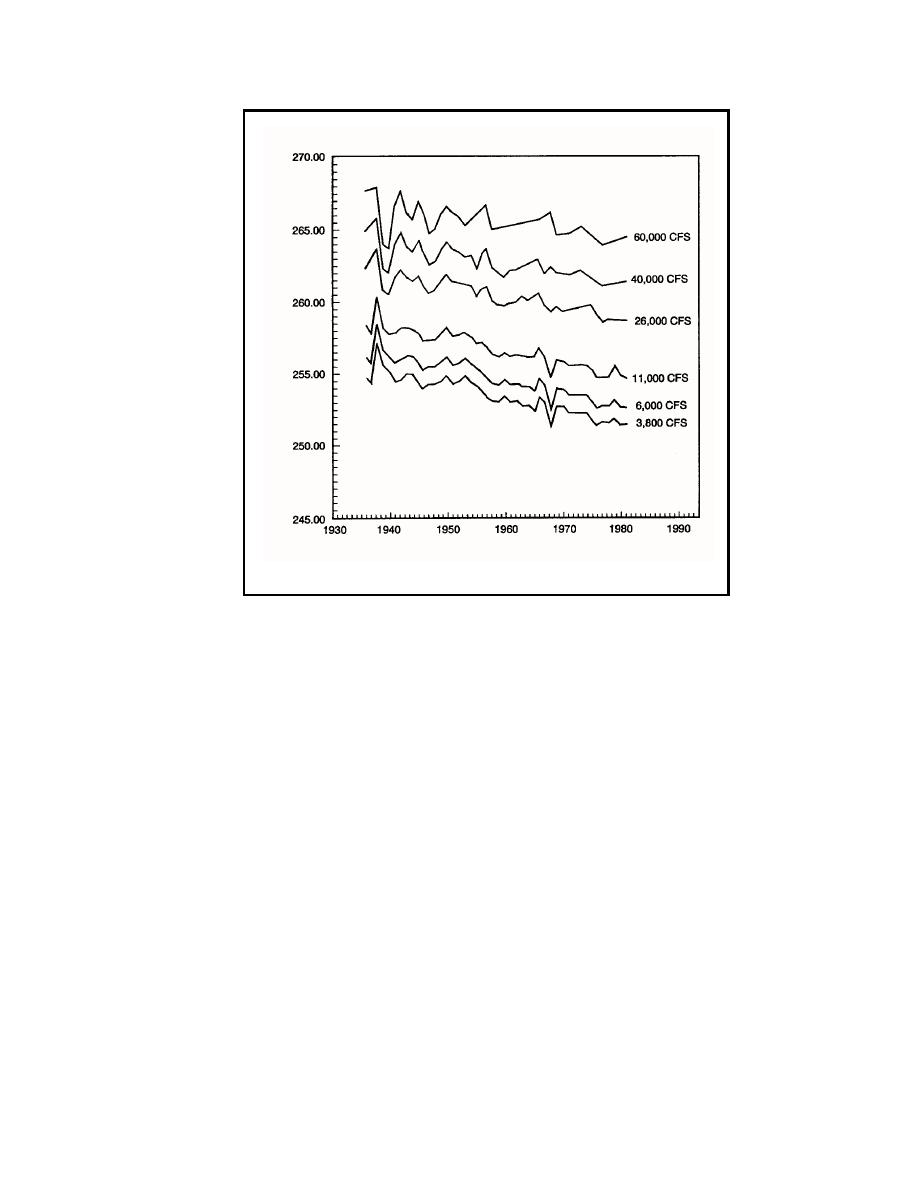
Figure 3.3 Specific Gage Plot for Red River at Index, Arkansas
The first step in a specific gage analysis is to establish the stage-discharge relationship
at the gage for the period of record being analyzed. A rating curve is developed for each year
in the period of record. A regression curve is then fitted to the data and plotted on the scatter
plot. Once the rating curves have been developed, the discharges to be used in the specific
gage record must be selected. This selection will depend largely on the objectives of the
study. It is usually advisable to select discharges that encompass the entire range of observed
flows. A plot is then developed showing the stage for the given flow plotted against time.
Specific gage records are an excellent tool for assessing the historical stability at a
specific location. However, specific gage records only indicate the conditions in the vicinity
of the particular gaging station and do not necessarily reflect river response farther upstream
or downstream of the gage. Therefore, even though the specific gage record is one of the
most valuable tools used by river engineers, it should be coupled with other assessment
techniques in order to assess reach conditions, or to make predictions about the ultimate
response on a river.
67
|
||
|
||


