
|
|

|
||
 250
A
200
150
100
50
0
June
July
August
September
40
B
30
20
10
0
1988
1989
1990
1991
1992
200
C
150
100
50
0
1991
1992
1993
1994
1995
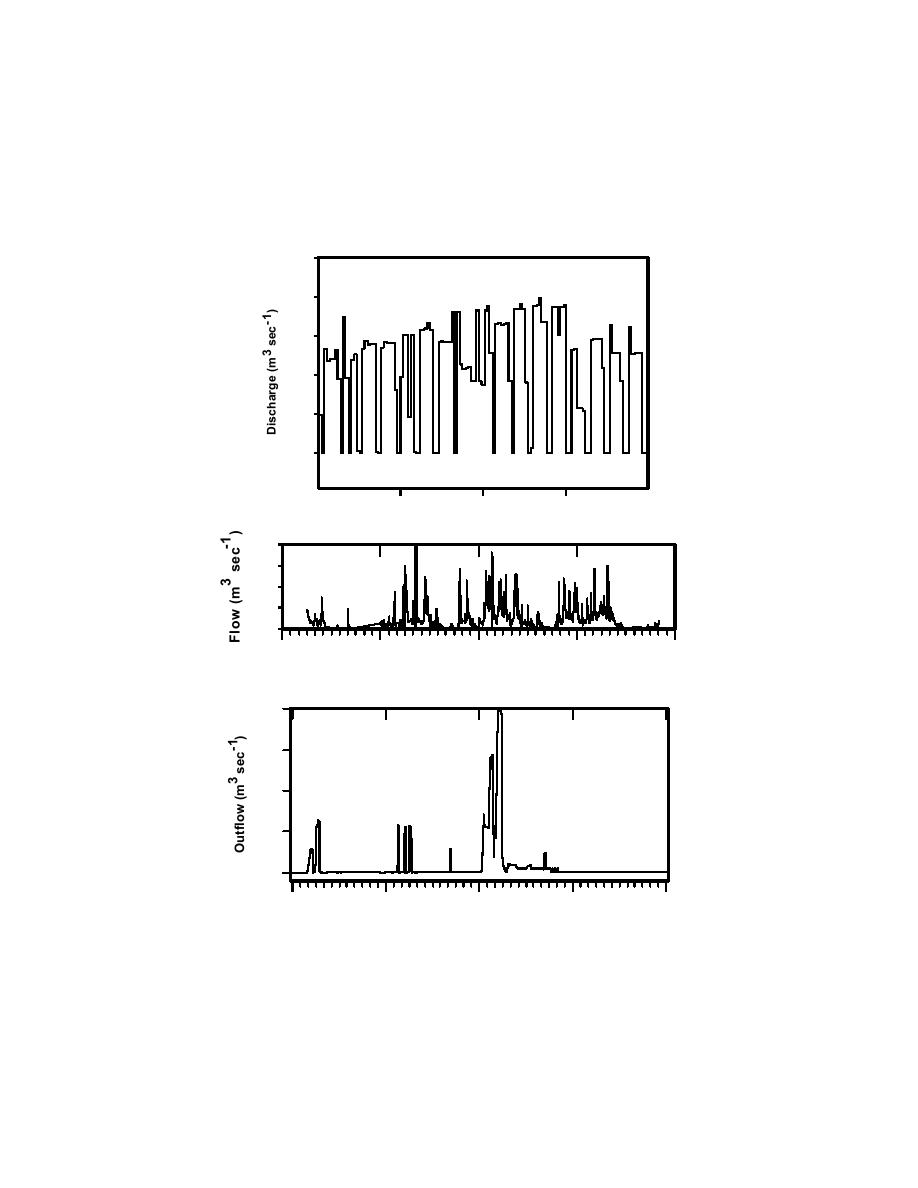
Figure 1.3.8 Hydrographs from (A) a hydropower operation (mean daily discharge), (B) a flood
control project in New York, and (C) a flood control project in Arizona.
1.3-10
|
||
|
||


