
|
|

|
||
 4
3
2
1
0
800
1600
2400
800
1600
2400
Time (hrs)
(a)
35
10
GENERATION
GENERATION
30
8
25
6
20
15
4
10
2
Temp
5
DO
0
0
800
1600
2400
800
1600
2400
Time (hrs)
(b)
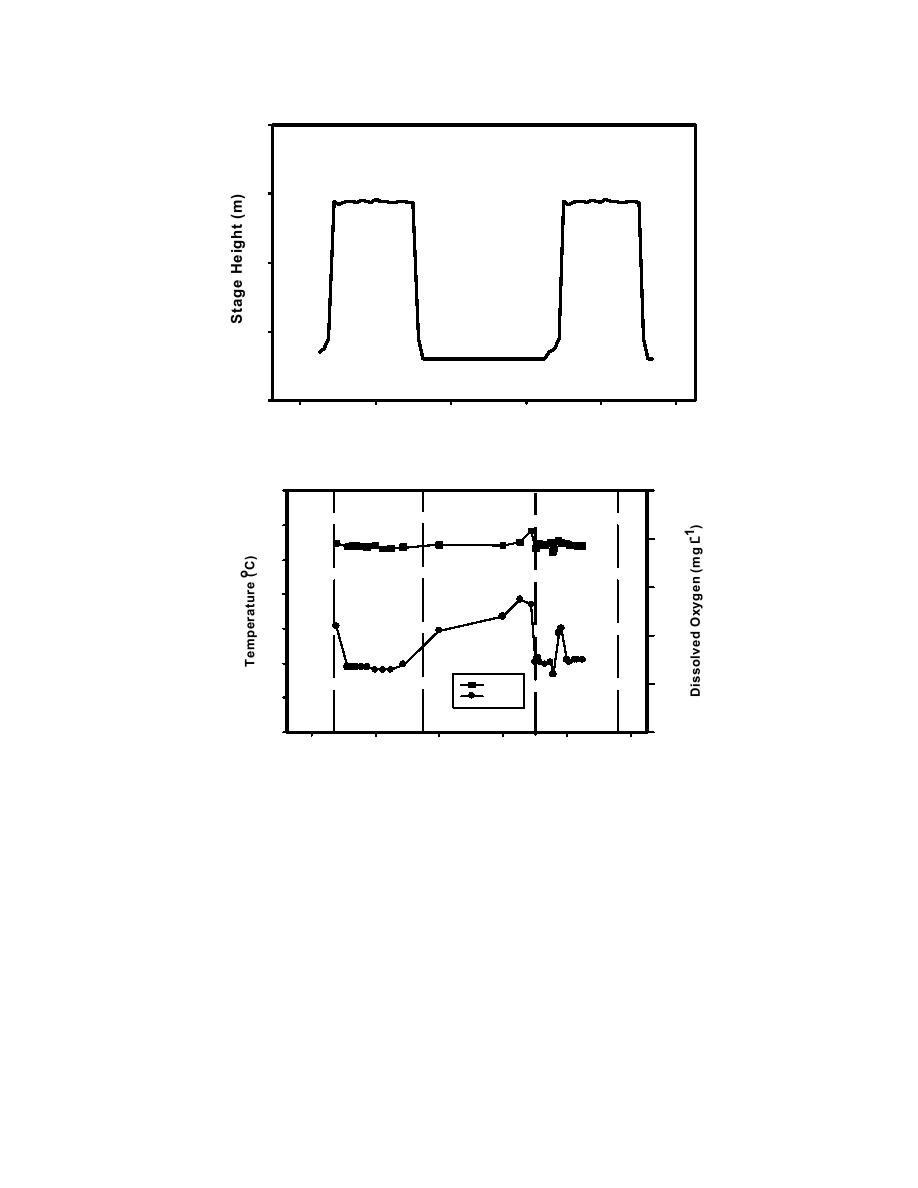
Figure 1.3.13 Temperature and dissolved oxygen concentrations in
response to peaking hydropower generation in (figure b provided for
reference) the tailwater of West Point Lake, Georgia and Alabama.
Note the diurnal warming and increase in dissolved oxygen which is
disrupted by the onset of generation as represented by change in
stage.
1.3-16
|
||
|
||


