
|
|

|
||
 t 2s 2
n'
(r0)2
where n= sample number, t2 (ranges between 0.675 and 2.57 for error probabilities between 0.05 and
0.50 with 5 degrees of freedom and restricts the effects of the error probability on sample size,
Gaugush 1987), s2 = variance, r = desired precision, 0 = mean value of the constituent.
Examples of determining sample size using simple random sampling, stratified random sampling,
and systematic sampling techniques are presented in Appendix 2.1A.
3. Sample Frequency
The frequency at which samples should be collected is a function of the temporal distribution of
the constituent dynamics and is related to the timing and duration of the factors contributing to the water
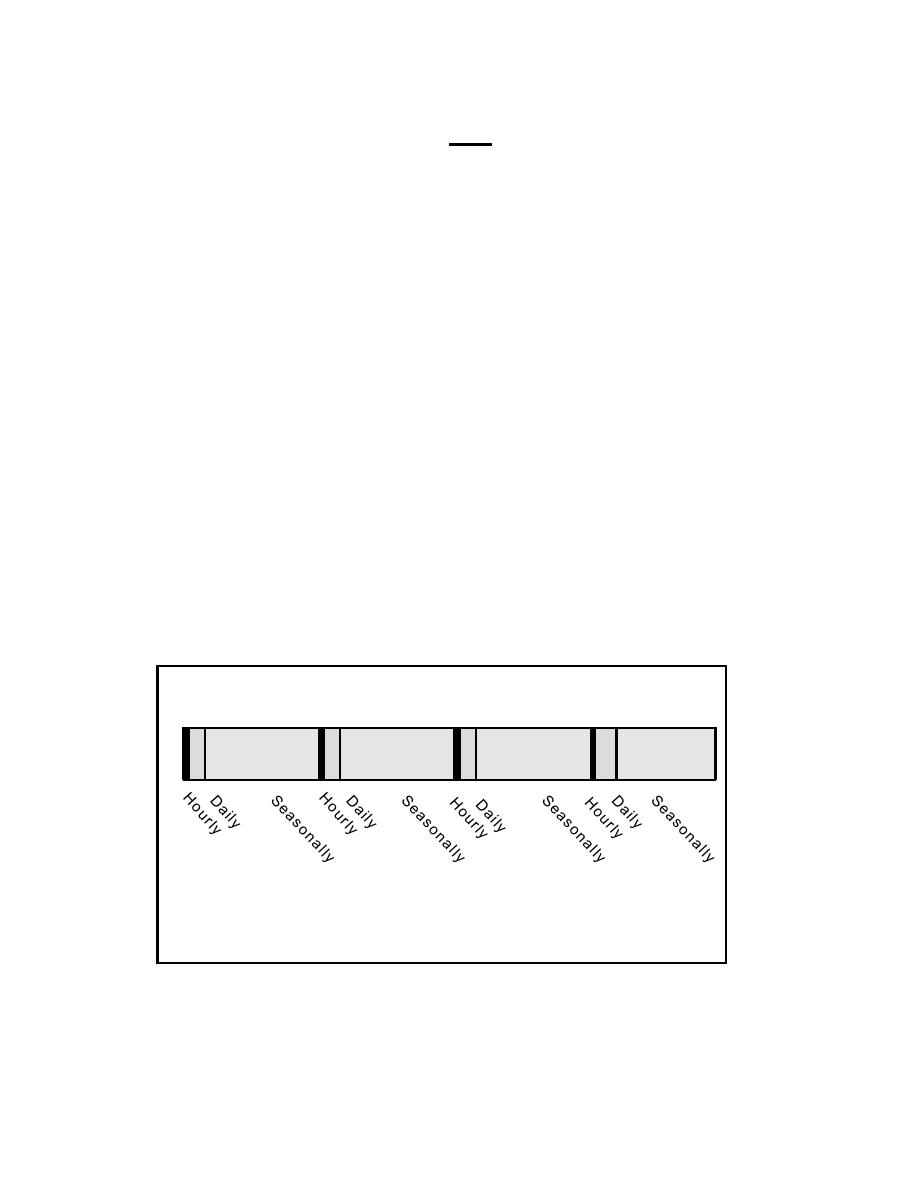
quality problem. A hypothetical time scale suggests relevant response periods of selected constituents
during an annual period (Figure 2.1.4). The age of most reservoirs is between 25 and 50 years so
trends over this period of time should also be considered. Daily cycles in release and biological activity
would require more frequent sampling than events that occur on a seasonal scale (e.g., anoxia,
increased concentrations in metals and nutrients). Even more frequent sampling for a shorter duration
may be required if microbial processes are a concern. Sample frequency may also be a function of
discharge if mass balance evaluations (e.g., loading) are to be conducted and critical periods during low
flow is a concern.
Annual
Hourly - Microbial Process, Fe Oxidation, Discharge
Daily - Photosynthesis/respiration, Biological development, Mn Oxidation, Discharge
Seasonally - Biological development, Nutrient/metal concentrations, Discharge
Annually - Biological development, Nutrient/metal concentrations, Discharge
Figure 2.1.4 Hypothetical time scale for selected physical, chemical
and biological processes
2.1-12
|
||
|
||


