Monitoring Program Design
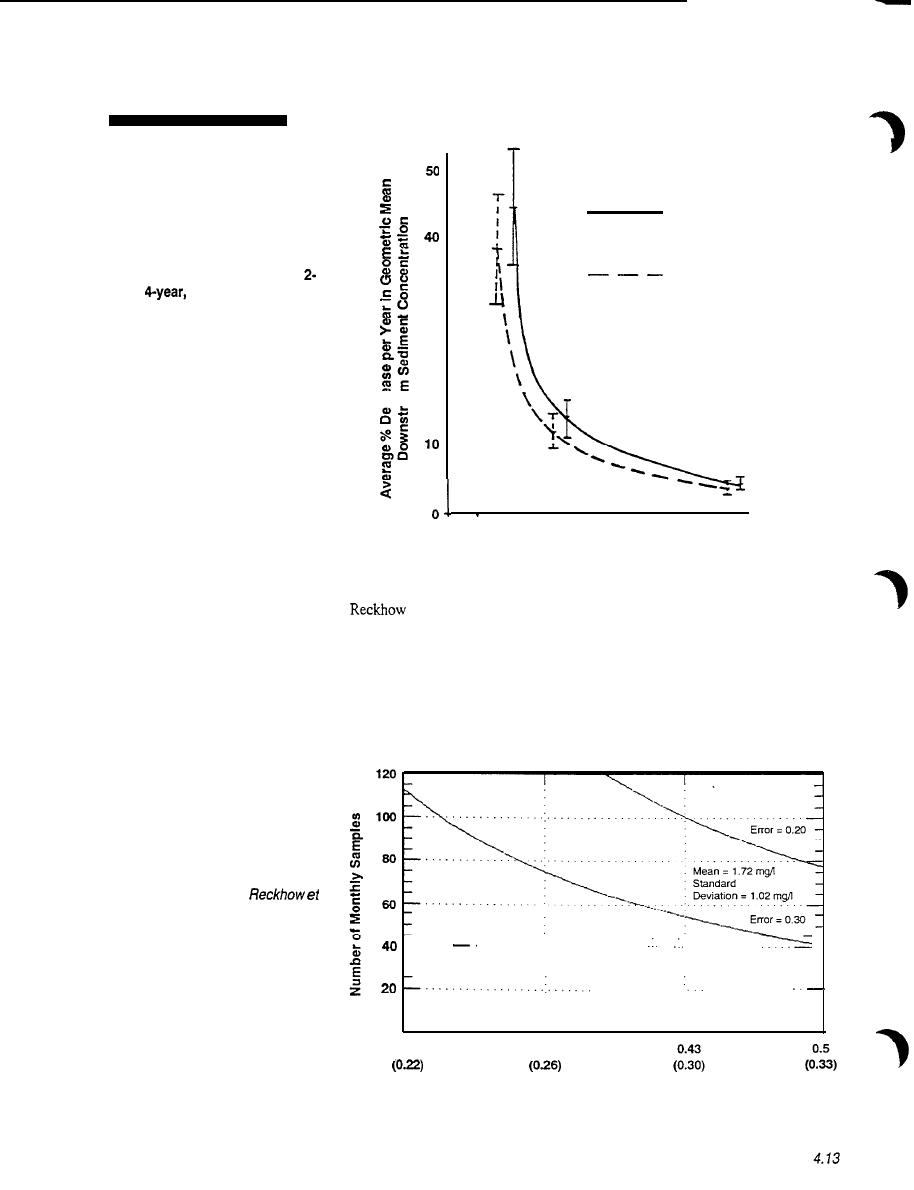
Figure 4.3 The average percent
No adjustment for upstream
annual decrease relative to the
sediment concentration
variation
initial yearly geometric mean
downstream sediment
Adjustments made for
concentration required to detect
upstream concentration
a significant decrease over a
variation
year,
and 1 O-year
30
monitoring scheme. This annual
decrease is calculated by: (total
percent decrease)/(number of
monitoring years, minus one).
The range over all subbasins is
20
shown. 20 samples per year are
Es
assumed. (Data from Idaho Rural
Clean Water Program monitoring
data.)
10
4
2
Years of Monitoring
et al. (1989) developed a method to determine the number of sampling
events required to detect a statistically significant change of a given magnitude and
range of error rates. The example provided in Figure 4.4 shows the number of
monthly samples needed to detect a 30% decrease in the total nitrogen concentration
at the Neuse River at Smithfield, North Carolina. Along the bottom of the figure the
fraction decrease is shown in parenthesis. For an error rate of 30% (0.30) the
approximate number of monthly samples required to detect a 30% decrease is 55.
Figure 4.4 Total number of
sampling events vs magnitude
of linear trend. (after
al. 1989)
.
I
I
0
0.28
0.35
Fractional lncrese (Decrease)


 Previous Page
