Bull Shoals Dam
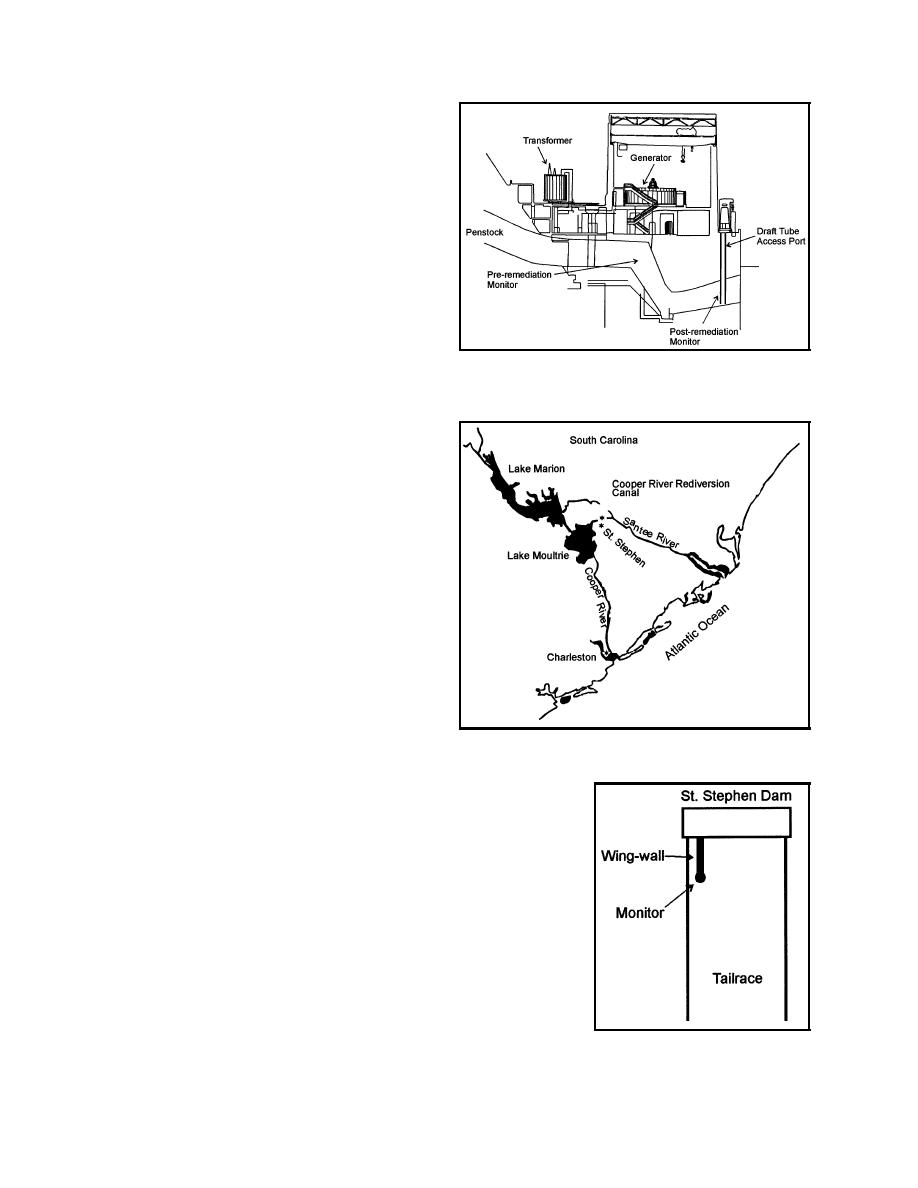
At Bull Shoals Dam on the White River,
Arkansas (Figure 9), the goal for the
monitoring program was to determine the
efficiency of turbine venting operations
conducted in order to increase downstream
DO concentrations. Two of the seven Bull
Shoals units had turbine venting capability,
and penstock monitors had previously been
installed to measure the pretreatment water
quality. In situ sampling demonstrated that
locating the posttreatment monitors in or
Figure 9. Bull Shoals powerhouse, White River,
near the draft tube exits would best represent
Arkansas
the release water quality. The draft tube
access ports were chosen for their proximity
to the draft tube exits and because they
afforded easy access for calibration and
maintenance. The concern was to isolate the
monitors from the release of the other units
to accurately identify the DO increase
resulting from individual turbine venting.
St. Stephen Dam
St. Stephen Dam is a Corps power project
located near St. Stephen, SC. The dam
rediverts water from Lake Moultrie back to
the Santee River (Figure 10). A fish kill
during spring 1991, which was attributed to
insufficient DO concentrations during
nonrelease periods, prompted evaluation of
the DO dynamics surrounding the project. It
Figure 10. St. Stephen Dam vicinity map
was determined that releasing water when
the DO concentrations were low caused
dilution of the poorly oxygenated canal water with
well-oxygenated reservoir water and prevented DO-related fish
kills. The monitor program implemented at St. Stephen was
designed to measure the tailrace DO concentration during
periods of no release. Real-time monitoring data were used to
indicate when critically low DO concentrations occurred so
water could be released, thus minimizing the potential for a fish
kill. Manual sampling indicated that the monitor should be
placed near the bottom of the canal and near the dam, since
anoxic conditions were realized in these areas first. A monitor
attached to the wingwall downstream of the dam (Figure 11)
represented "worst-case" conditions (Vorwerk and Carroll 1995).
Figure 11. Schematic of the
St. Stephen Dam tailrace monitor
10
Water Quality Technical Note AM-02 (January 1998)


 Previous Page
