is
the lake concentration after dilution (subscript
where
refers to conditions before dilution, and subscript 2 refers to conditions
after dilution).
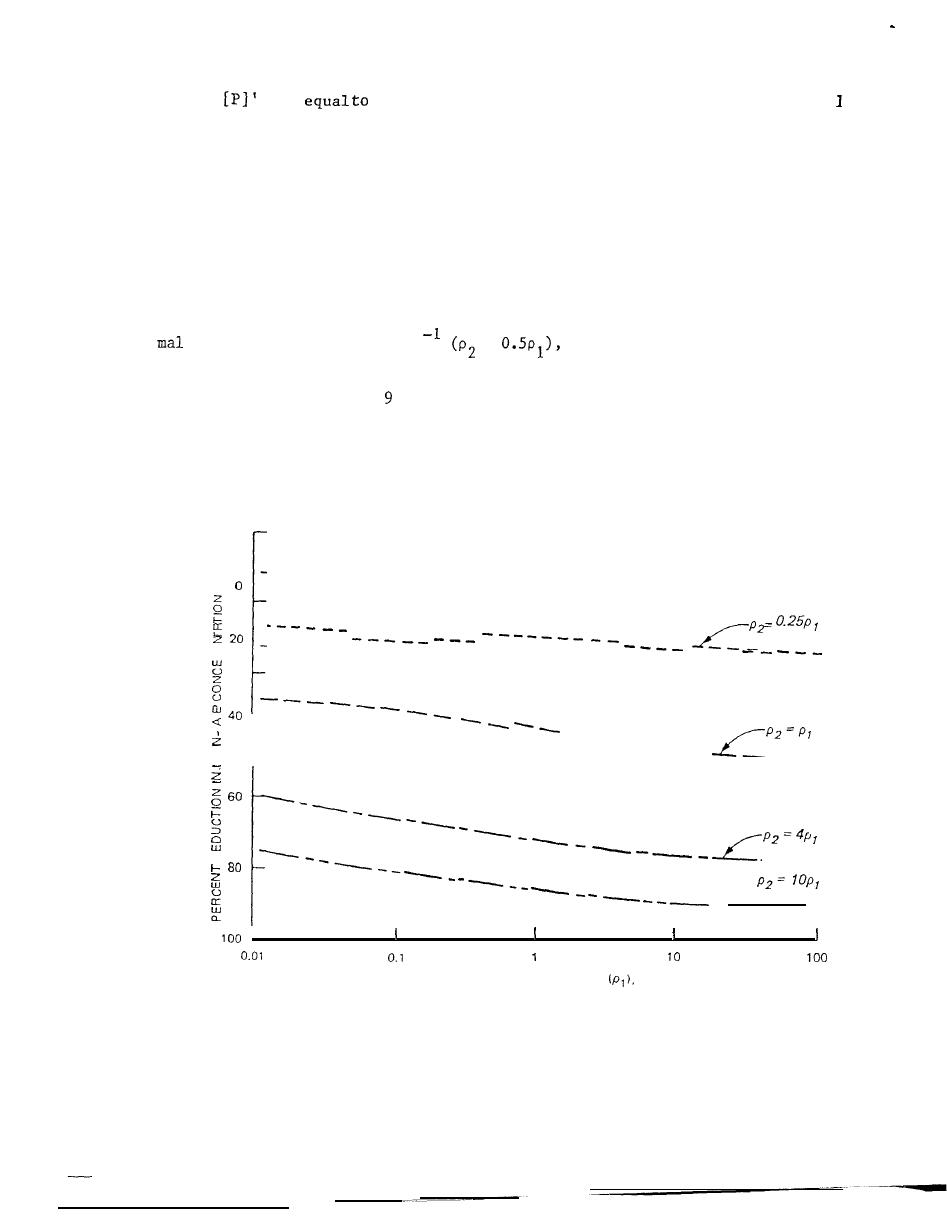
Figures 9 and 10 illustrate the effects of the addition of dilution
water on the in-reservoir concentration.
The X-axis gives the flushing. rate
before dilution, and the lines on the graph show flushing rates due to dilu-
tion only, expressed as a constant proportion of undilutedflow.
Thus, using
Equation 12 and assuming that there is no phosphorus in the dilution water and
that the dilution is equal to half the normal flow for a reservoir with a nor-
=
theory predicts a 26-percent
flushing rate of 1.0 year
reduction in in-reservoir phosphorus concentration.
As Uttormark and Hutchins
point out, and as Figure
illustrates, large quantities of dilution water are
needed to produce a significant change in reservoir phosphorus concentration.
Figure 10 illustrates the more realistic case wherein dilution water
contains 40 percent of the phosphorus concentration found in the normal
undiluted inflow.
This graph clearly shows that greater and greater quan-
tities of dilution water do not necessarily result in progressively greater
Y
-
--
-
-
-
-
a
-
-
_
/
FLUSHING RATE BEFORE DILUTION
YEAR-'
Figure 9. Percent change in in-lake phosphorus concentration follow-
ing dilution with water containing no phosphorus (after Uttormark and
Hutchins 1978). (See text for explanation)
66


 Previous Page
