
|
|

|
||
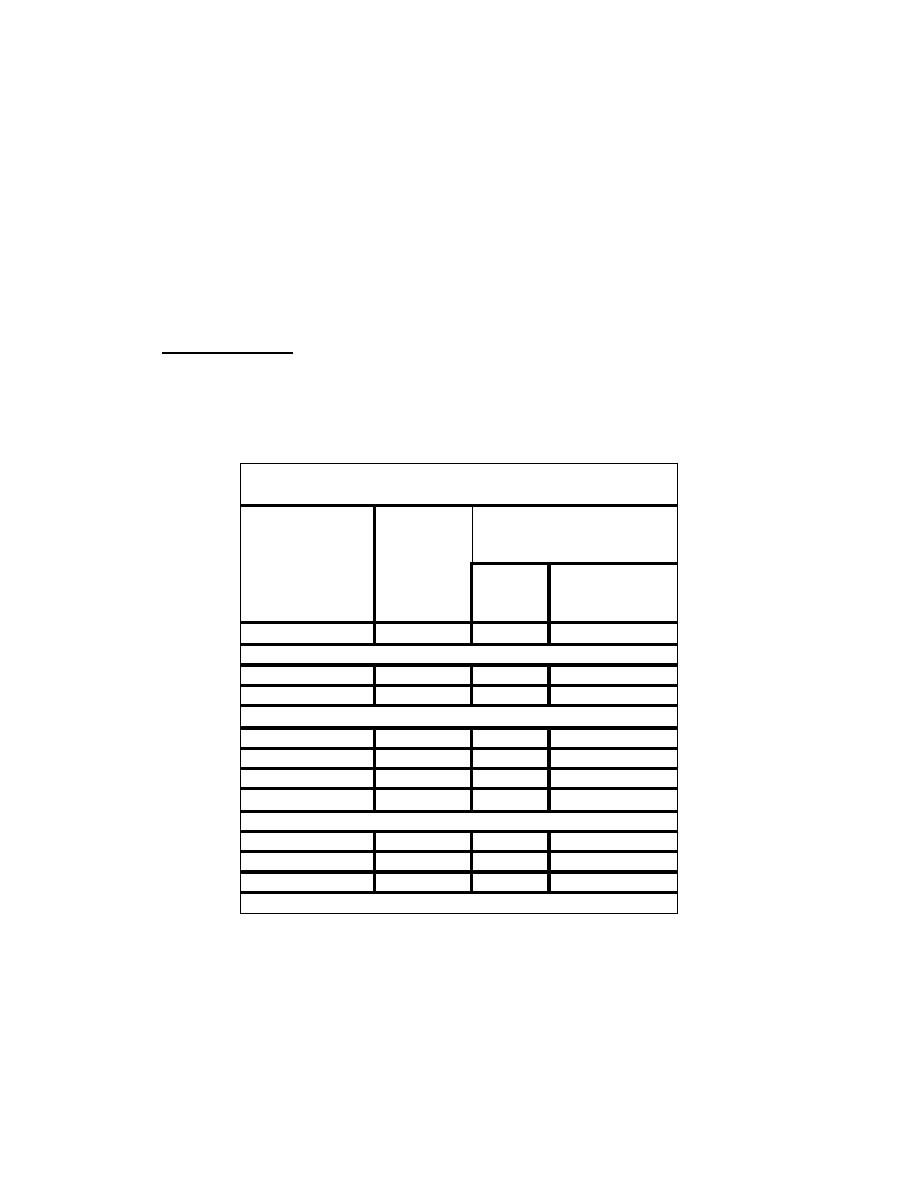 concentrations are taken from the range of EMC values pooled for all the NURP projects except for
open/non-urban sites.
The median urban site values in Table 1.1.7 are recommended for pollutant runoff modeling.
The 90th percentile values may serve as an upper conservative estimate for the EMC if desired. To the
left of the EMCs are the ranges of coefficient of variation (CV = standard deviation divided by the
mean) found for monitored runoff values. Higher CV values means lower confidence in the mean point
estimate. These general values are given since land use category was found to explain little of the
variability found in urban pollutant runoff.
Storm event runoff (Q) may be determined from the CNE (See section 1.1.1.3) or regression
model by Schuler (1987). Table 1.1.8 provides a list of curve numbers for urban land use types. Each
method considers the percentage of the source area covered by impervious surfaces such as paved
roads, parking lots, or rooftops.
Table 1.1.7. Urban Event Mean Concentrations for Several Pollutants
and their Variability
Site Median EMC
Event to Event
Variability
Constituent
In EMC's
For
For
(Coef Var)
Median
90th Percentile
Urban site
Urban Site
TSS (mg/1)
1-2
100
300
BOD (mg/l)
0.5-1.0
9
15
COD (mg/l)
0.5-1.0
65
140
Tot. P (mg/l)
0.5-1.0
0.33
0.70
Sol. P (mg/l)
0.5-1.0
0.12
0.21
TKN (mg/l)
0.5-1.0
1.50
3.3
NO2+3 -N (mg/l)
0.5-1.0
0.68
1.75
Tot. Cu (ug/l)
0.5-1.0
34
93
Tot. Pb (ug/l)
0.5-1.0
144
350
Tot. Zn (ug/l)
0.5-1.0
160
500
(after EPA, 1983)
1.1-30
|
||
|
||


