
|
|

|
||
 500
400
300
200
100
0
MON TUE WED THU
FRI
SAT SUN MON TUE WED THU
FRI
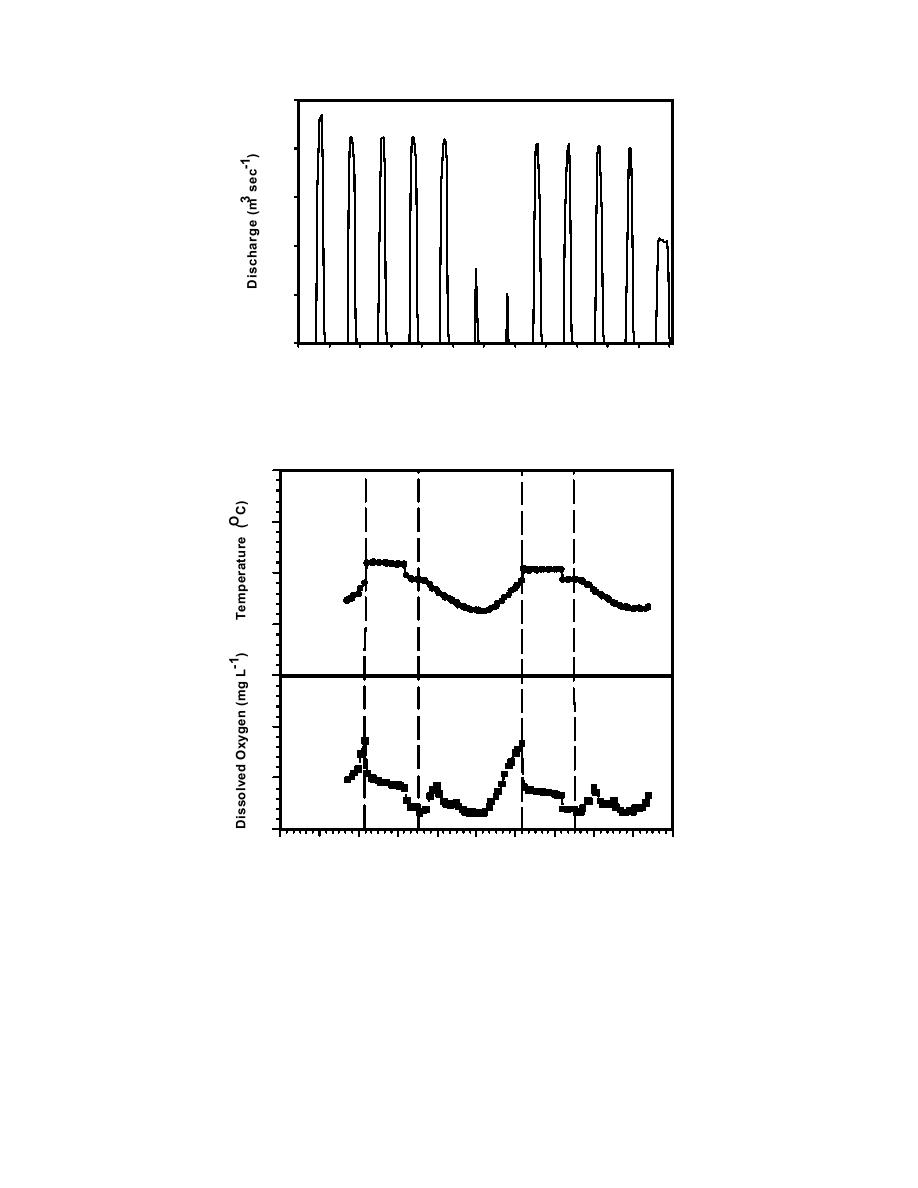
Figure 1.3.9 Hourly discharge from a peaking,
hydropower operation.
35
GENERATION
GENERATION
30
25
20
15
10
5
0
2400
600
1200
1800
2400
600
1200
1800
2400
600
1200
Time (hrs)
Figure 1.3.10 Temperature (upper panel) and dissolved oxygen
concentrations (lower panel) before, during, and after peaking
hydropower generation at the tailwater of Lake Texoma, Oklahoma
and Texas. Vertical dashed lines depict the start and stop times for
generation. The decrease in temperature and dissolved oxygen near
the end of generation reflect changes in water quality in the
withdrawal zone when one of the two turbines were shut down
1.3-11
|
||
|
||


