
|
|

|
||
 5
5
4
4
Distance (km) vs TMn L
Distance (km) vs TFe L
Distance (km) vs DMn L
Distance (km) vs DFe L
Distance (km) vs TMn H
Distance (km) vs TFe H
3
3
Distance (km) vs DMn H
Distance (km) vs DFe H
2
2
1
1
0
0
0
2
4
6
8
10
0
2
4
6
8
10
Distance (km)
Distance (km)
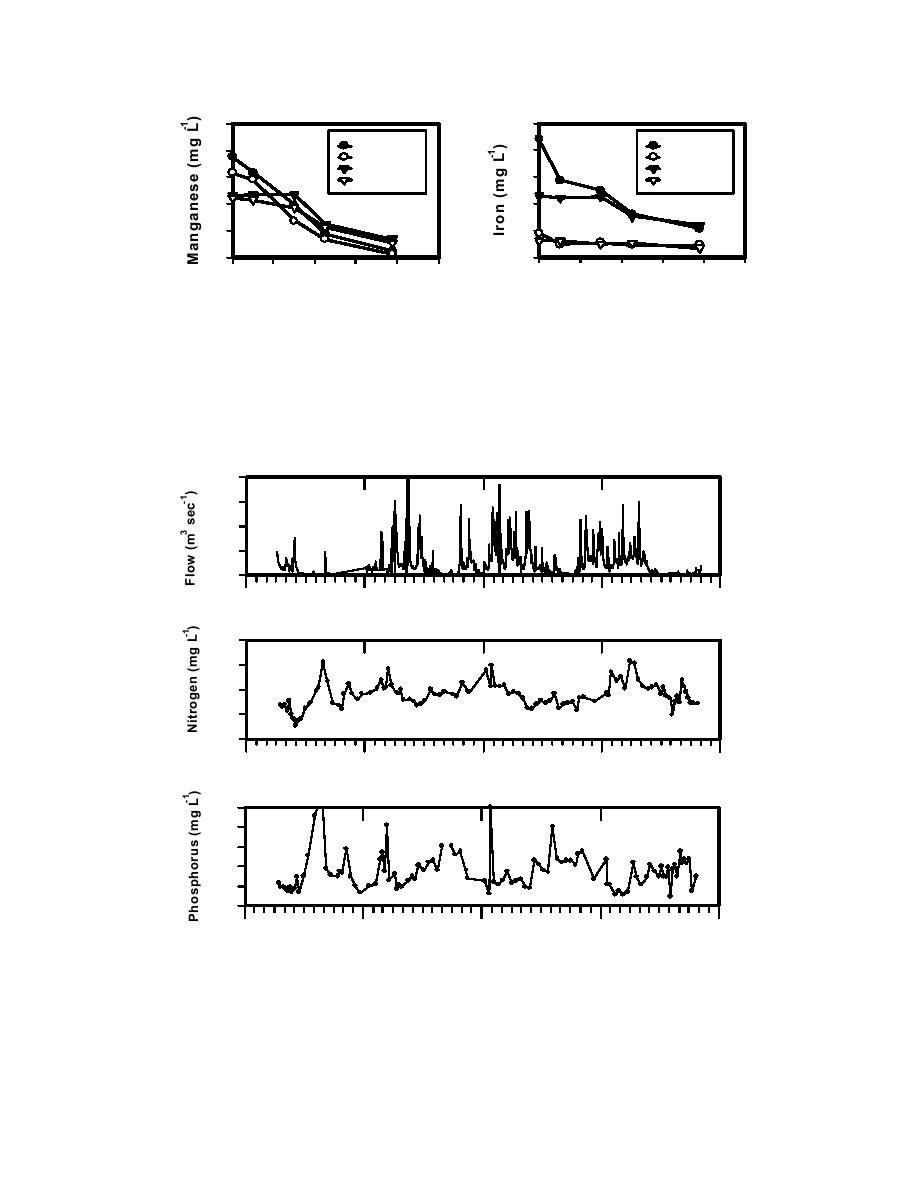
Figure 1.3.18 Spatial trends in total and dissolved iron and manganese
concentrations in reservoir tailwaters during high (H) and low (L) flow
(Nimrod Lake, AR).
40
30
20
10
0
2.0
1.5
1.0
0.5
0.0
0.10
0.08
0.06
0.04
0.02
0.00
1988
1989
1990
1991
1992
Figure 1.3.19 Temporal patterns of total nitrogen and phosphorus concentrations in
reservoir tailwaters (East Sidney Lake, NY).
(Hydrograph provided for reference.)
1.3-22
|
||
|
||


