2. Development of BMP Cost-Effectiveness
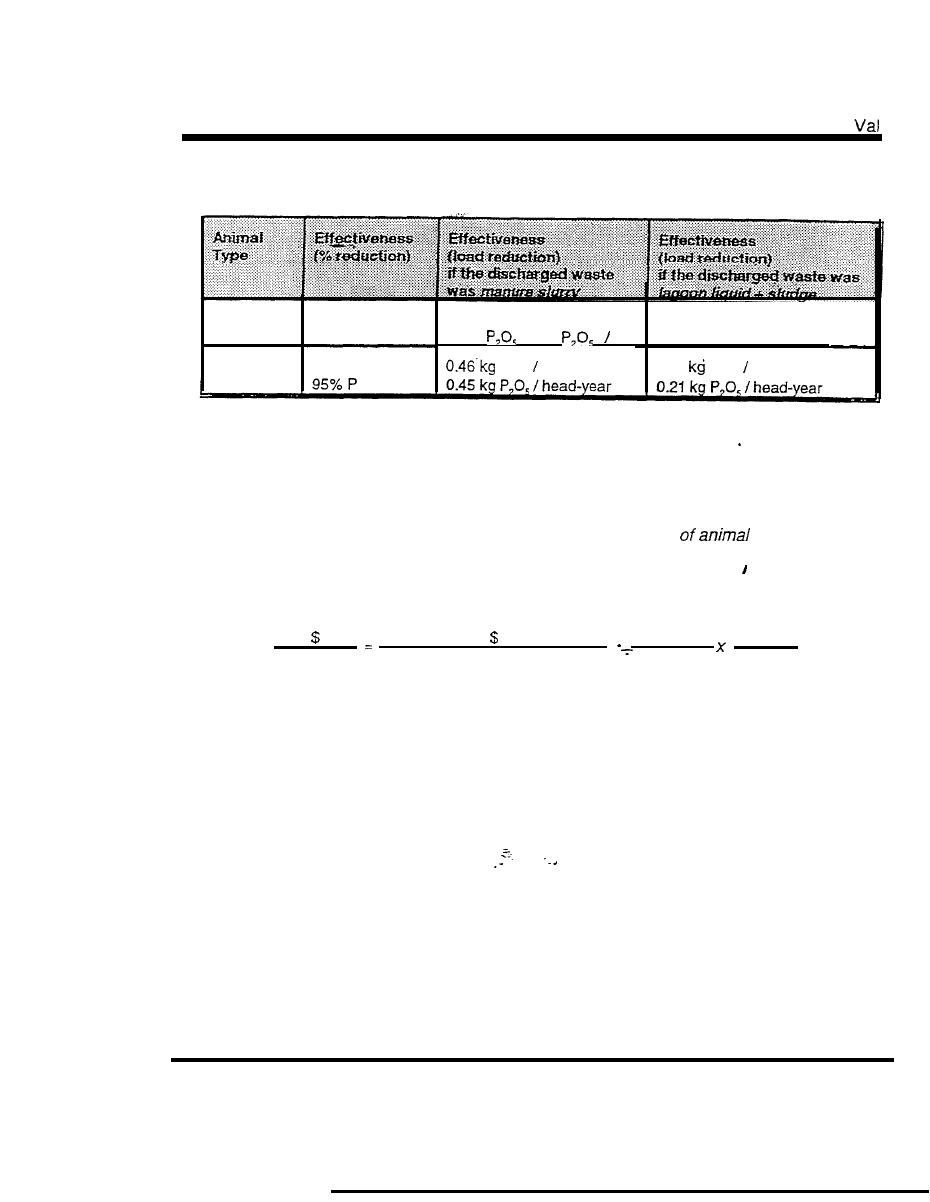
Table 2-6.
Effectiveness of Land Application Relative to Direct Discharge
96 kg TKN /head-year
Swine
80% N
25 kg TKN /head-year
k /head-year
95% P
2 877kg
g
head-year
Poultry
80% N
TKN head-year
0.10
TKN
head-year
Using the cost figure from Table 2-2 and the effectiveness estimates from
Table 2-6, we can now estimate the cost-effectiveness of land application in
reducing nutrient loads (relative to direct discharge). This process is
complicated by the fact that we have measured the effectiveness of land
application in terms of nutrient reduction per head
while the cost
estimates are measured per hectare of applied waste. The following equation
was used to perform the appropriate conversions.
kg reduced
hectares
kg reduced
head-year
head
hectare of land application-year
The parameters for the above equation vary by animal type and by the nutrient
needs of the receiving crop. Table 2-7 summarizes these parameters and
presents the resulting ranges of estimated cost-effectiveness values.
Calculation details are presented in Appendix 6.
16


 Previous Page
