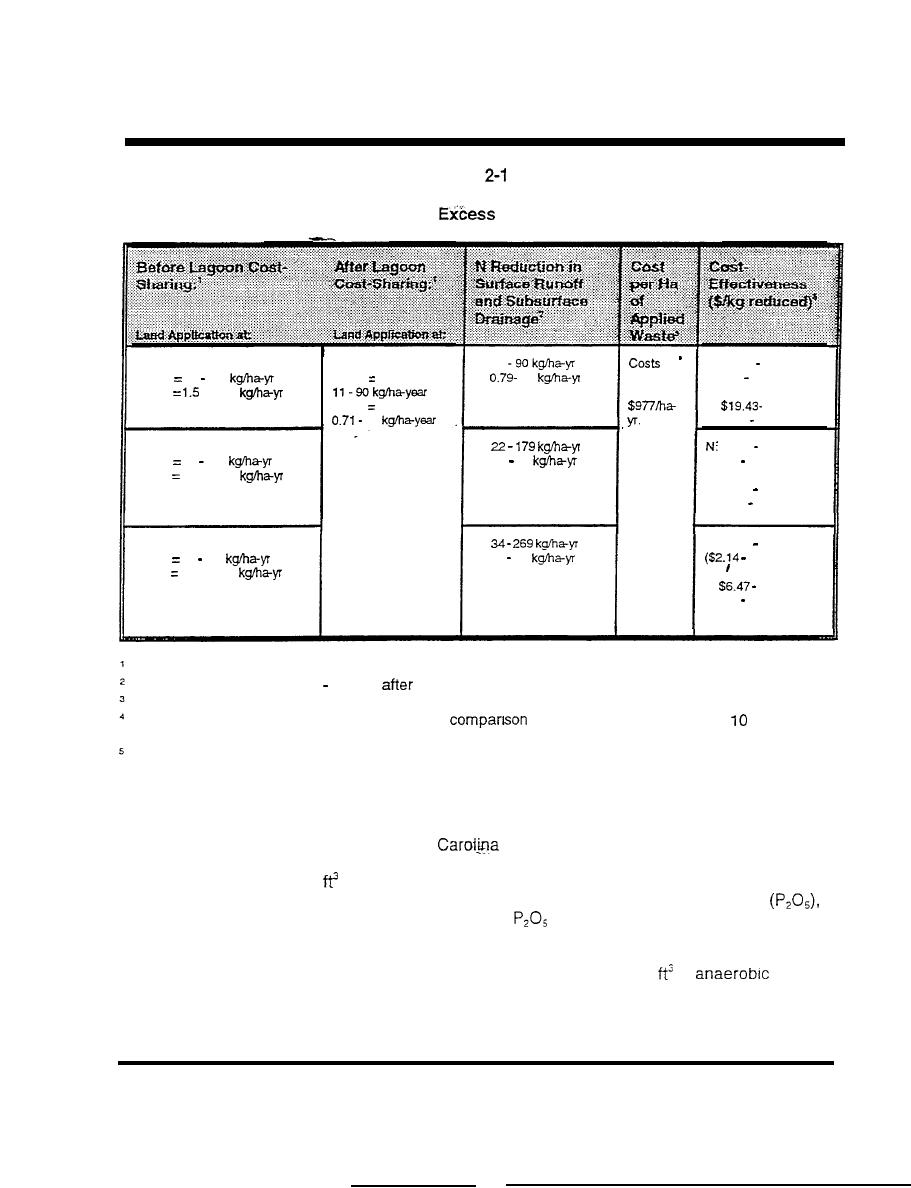
2. Development of BMP Cost-Effectiveness-Values
Table
0.
Cost-Effectiveness of Anaerobic Lagoons Relative to Land Application
Rates
at
N: 11
Agronomic Rates
N: .86 21.05
2x Agronomic Rates
range from
(.44 .86)'
N loss
P:
22
N loss 22 179
5 to
P loss
to 44.8
P loss
5298.30
P:
22
(.76 4.94)
N:
.43 .52
3x Agronomic Rates
P: 1.5 45
(2 .93)
N loss 34 269
P loss 2.2 to 67.2
P: .71 8.20
(.88 9.40)
N:
N:
||content||
.62 .02
4x Agronomic Rates
P: 22
67
.29)
N loss 45 359
P loss 2.9 to 89.7
P:
7.63
(.57 142.47)
From Table 2-4.
(losses before cost-sharing) (losses
cost-sharing).
From Table 2-9.
The numbers in parentheses are presented for
purposes and are based on a
year life
span instead of the SCS life span of 20 years.
See Appendix 6 for calculation details.
a database of manure, lagoon sludge, and lagoon liquid characterization from
North Carolina farms (North
Agricultural Extension Service, 1990).
Based on these data, the averagenitrogen (TKN) reduction for a swine waste
of treatment volume per pound of live weight is 73 percent or
lagoon with 1
0.374 lb N per thousand pounds live weight per day. For total phosphate
the reduction is 69 percent or 0.272 lb
per thousand pounds of live weight
per day.
For poultry waste lagoons, the SCS guidelines require 2.5
of
lagoon
treatment volume per pound of live weight (R. Hansard, 1994). Based on the NC
Extension data mentioned above, the nitrogen (TKN) reduction for this type of
lagoon is 77 percent or 0.658 lb N per thousand pounds of live bird weight per
21


 Previous Page
