Approach for Mean Data
Data Collection and Preparation
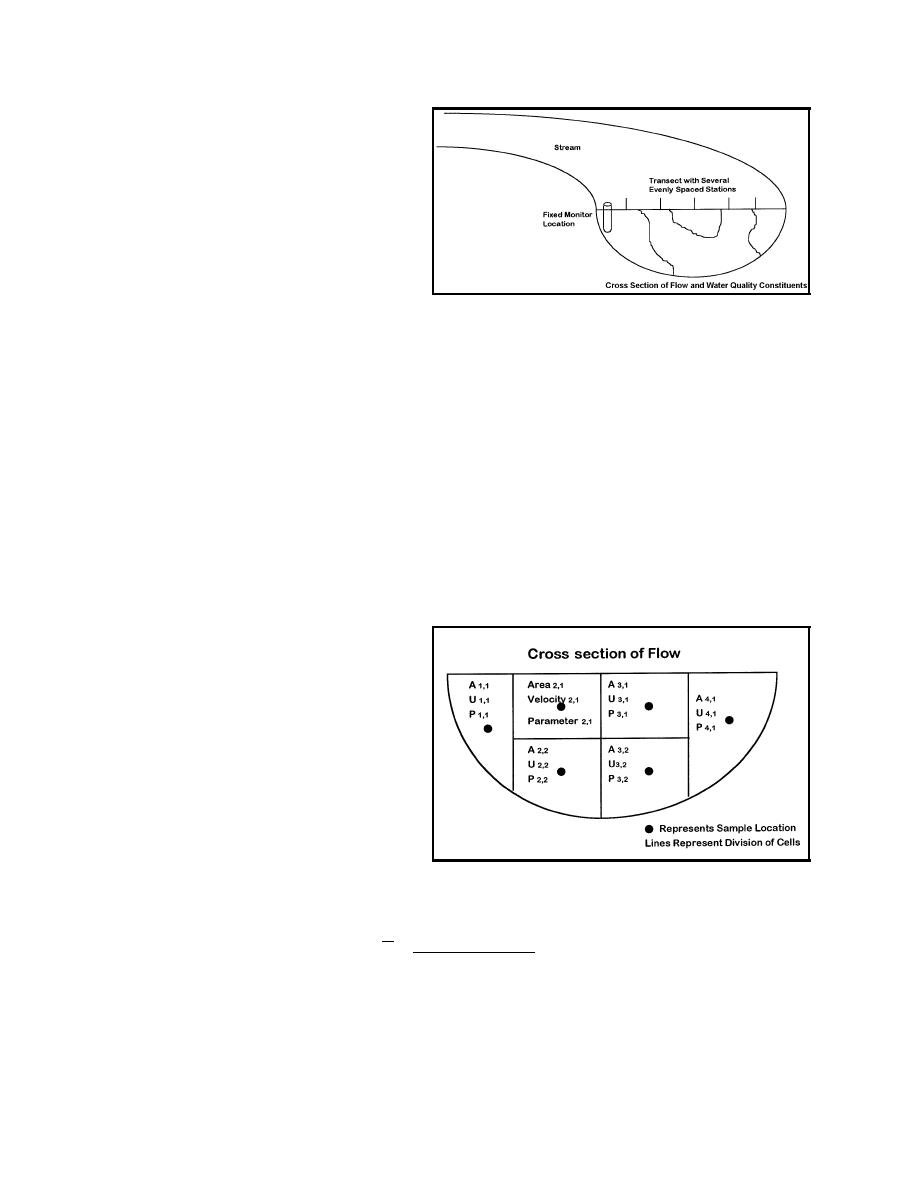
The basic approach to verifying the
representativeness of a monitor site is to
compare matched pairs of observations
from the monitor and averaged from the
flow (Figure 2). These pairs must be
taken over as many different times, flow
Figure 2. Cross section of flow with evenly spaced sample
conditions, and water quality variations
stations along a transect
as possible.
The observations in the flow must be distributed so they adequately describe water quality
conditions across the stream. For wider streams and rivers or for more highly variable water
quality conditions, more sample locations are necessary. The sample values from the stream are
averaged with an area-weighted average. If velocities vary greatly in the stream cross section, the
data averaging must also be flow-weighted. The next section provides details on this weighting.
In practice, data are often limited, and the only available option is averaging the transect data
with a simple arithmetic average, and then carrying out the statistical comparison. However, if
the stations are not evenly spaced or if the water column has lateral or vertical heterogeneities in
water quality or velocity, then a flow-weighted average should be calculated.
Flow-Weighted Data
The following method can be used to
calculate a flow-weighted average. For
each sample station, i, and depth, z, with
velocity Ui,z and water quality parameter
value Pi,z, assign an area Ai,z that the
information gathered at that location
represents (Figure 3). The area can be
difficult to calculate and is most often
approximated from depth soundings,
maps, surveying techniques, global
positioning equipment, and "best-guess."
The transect flow-weighted average of
Figure 3. Hypothetical sample scheme for
the parameter P can then be expressed as
flow-weighting data
z max
∑ ∑A
Ui,z Pi,z
i,z
z=0
P=
all i
z max
∑ ∑A
Ui,z
i,z
z=0
(1)
all i
3
Water Quality Technical Note AM-03 (January 1998)


 Previous Page
