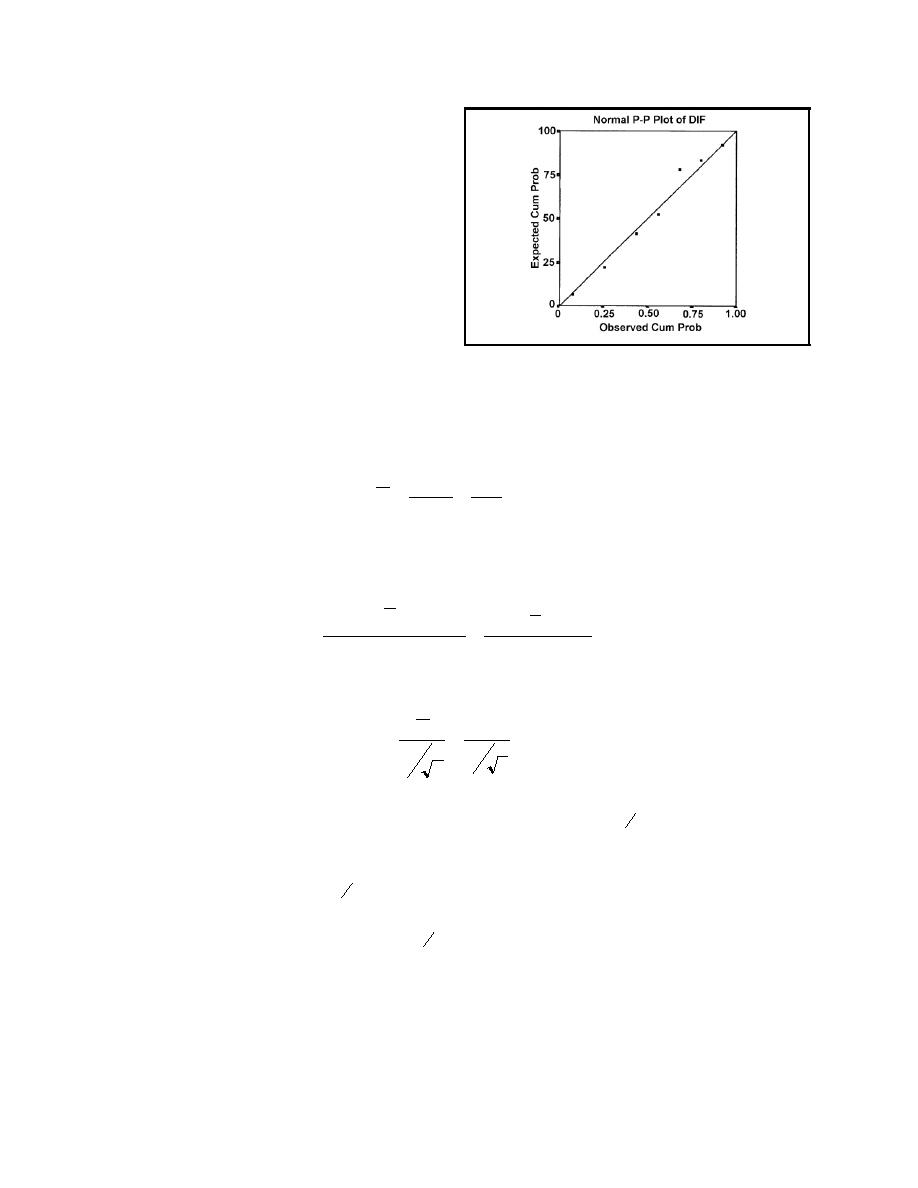
Figure 6 is a normal probability plot of the
differences between the transect and fixed
monitor data pairs. Though the data show
some tendency to be lower than the normal
plot for low probabilities and higher than the
normal plot for high probabilities, the data
appear to be approximately normally
distributed.
Equations 2 and 3 were used to test
whether the data collected at the fixed
monitor site represent the water quality
within the river. First, the parameters
Figure 6. Normal probability plot of the differences
necessary for the test statistic were calculated.
between transect and fixed monitor station pairs of
observations. (Straight line plots the normal
The mean difference (Equation 5) was
distribution; square symbols are the differences.)
n
∑D
j
20.1
j =1
D=
=
= 2.5
(10)
n
8
The variance was estimated using Equation 6:
I
1F
2
- G∑ D J
af
n
n
∑D
K
nH
1
2
60.1 -
2
20.1
j
j
j =1
j =1
8
SD =
=
= 1.4
2
n -1
8 -1
(11)
The test statistic, t0, was then calculated using Equation 4:
D
2.5
t0 =
=
= 5.9
SD
1.2
8
n
(12)
Next, the test statistic calculated in Equation 12 was compared with tα
. This value can be
2,n-1
found in various statistics books in the Students' t table or t distribution table (Hines and
Montgomery 1980, p 596). For α = 0.05 (our choice) and υ = n 1 = 7 (determined by the
sample size of 8), the value of tα ,n-1 = t0.025,7 = 2.365 (from tables). Then, since
2
5.9 = t0 > tα
= t0.025,7 = 2.365
2,n-1
(13)
we rejected H0 and concluded that the difference between the transect values and the fixed monitor
station values was not zero. The fixed monitor did not adequately represent the water quality in the
river at this location.
8
Water Quality Technical Note AM-03 (January 1998)


 Previous Page
